
Stagflation revisited
Did we get the whole macro story wrong?

Hello, world. I’m back.
OK, I never went away. You can read me at the New York Times and on Twitter, and you might think I don’t need another outlet. But I’ve been feeling for a while that I needed to resume blogging, at least to a limited extent, and neither Twitter nor The Times filled the need.
True, I used to blog at The Times, and I’m still free to post whatever I want, whenever I want. However, I no longer have a separate blog there; blog posts look to the unwary just like columns. And I’ve found that to be a problem for wonkier items: even when I add a warning label, lots of readers expect them to be written in English and comprehensible to normal human beings, and get dismayed at encountering a wall of economese.
So I’m starting this blog/newsletter as a place to put my less general-public-friendly thoughts. It will be free, at least for now — I’m looking for a place to wonk out, not an extra flow of income. I also don’t know how often I’ll post; certainly not every day, and maybe not even every week. But I do hope that people with an interest in the wonkier aspects of life will subscribe. Please clap.
Without further ado, then, here’s my first entry.
The Legend of Milton Friedman — and Paul Volcker
The other day I attended a virtual seminar given by Emi Nakamura, one of the brightest younger economists out there, on the slope of the Phillips curve. Nakamura, together with Jon Steinsson, has been at the cutting edge of empirical macroeconomics, with a research style that typically involves making use of novel data — often, although not always, regional data. For example, N/S made a big impact during the stimulus/austerity wars with a paper using the differential impact of military spending across states to estimate multipliers. The new paper uses a similar approach to estimate how much impact unemployment has on the inflation rate.
They’re not the first to do this, but as I understand it they improve on earlier estimates by carefully constructing state-level price indexes for nontraded goods and services — a laborious undertaking. (Some of the older data was on microfilm cartridges — and some years are missing because the cartridges have been lost!)
What they find is that the Phillips curve is very flat. That is, low unemployment does lead to higher inflation, but even a very hot economy only leads to modest inflationary overheating.
OK, that’s useful to know and has important implications for current policy (as in, chill out about Biden’s big spending plans). But what I want to focus on are the disturbing implications of this result for our understanding of both economic history and the history of economic thought.
Let me start with the inflation story the way most economists, myself included, have been telling.
In the beginning was the Phillips curve: the apparent tradeoff, fairly visible in the data, between unemployment and inflation. In the 1960s many people looked at that tradeoff, considered the mild costs of inflation versus the benefits of lower unemployment, and argued for monetary and fiscal policies aimed at running the economy hot.
But in a hugely influential speech Milton Friedman made an argument also independently made by Columbia’s Edmund Phelps: the unemployment-inflation tradeoff wasn’t real, because any sustained effort to keep unemployment low would lead not just to high inflation but to ever-accelerating inflation. They claimed, specifically, that people setting wages and prices would begin marking them up to anticipate future inflation, so that the inflation rate associated with any given unemployment rate would keep rising.
They predicted, in particular, that the course of the economy over time would look something like this:

First, a government would push unemployment down; but this would lead to ever-rising inflation, which would stay high even as the economy cooled. So it would take a sustained period of high unemployment to get inflation down again, until finally unemployment could be brought back to a sustainable level.
So their analysis predicted “clockwise spirals” in unemployment and inflation. Then came the 1970s:

This sure looked like a dramatically successful out-of-sample prediction — sort of an economics version of “Light bends!” Almost everyone in the economics profession took the Friedman-Phelps analysis as confirmed. This in turn had big practical and intellectual consequences.
First, governments and central banks stopped pursuing low unemployment, believing that excessively ambitious stimulus caused the stagflation of the 1970s. They began aiming for stable unemployment around the NAIRU —non-accelerating-inflation rate of unemployment — instead.
Second, since the Friedman/Phelps prediction was based on trying to assess what rational price-setters would do, their apparent success gave a big boost to the notion that all economics should be based on maximizing behavior. Friedman always had too strong a reality sense to personally go down the rational-expectations rabbit hole that swallowed much of macroeconomics, but given the law of diminishing disciples it was bound to happen.
Third, the whole affair gave a boost to conservative ideology. We had seemingly seem a demonstration of the limits to government action; also, the Chicago boys had seemingly been proved right about something big. (I remember classmates in grad school saying “They were right about this. Why don’t you think they’re right about the rest?”)
Finally, the Volcker disinflation of the 1980s — using high unemployment to end high inflation — became, in many minds, the model of what responsible policymakers should do: make tough choices for the sake of the future.
But what if we’ve been telling the wrong story all along?
Revisiting that 80s show
When the Great Recession struck, many people, myself included, worried about deflation. (Many other people, especially gold bugs, worried about inflation; but never mind them.) We expected a Volcker-era-like period of very high unemployment to cause a Volcker-like decline in the inflation rate, which would have put us substantially underwater. But while there was some decline in inflation, it wasn’t very big. Nor did inflation rise by much as the economy reflated, even when unemployment dropped below 4 percent.
This led many observers to conclude that the Phillips curve is now quite flat. What the Nakamura et al analysis suggests, however, is that it was always very flat.
They aren’t the first to say this, but I’ve been provisionally skeptical of other analyses, worrying that they may be overfitting the data. The regional approach, it seems to me, is safe from that critique: they just use the obvious formulation, and given their use of time fixed effects they aren’t in any sense fitting the rest of the model to what we know happened over the decades.
There is, however, a problem. The estimated slope of the Phillips curve is so flat that it says that the unemployment bulge of the early 1980s, big as it was, isn’t enough to explain the Volcker disinflation.
So what does explain the disinflation? A big fall in expectations of future inflation. Their picture looks like this:
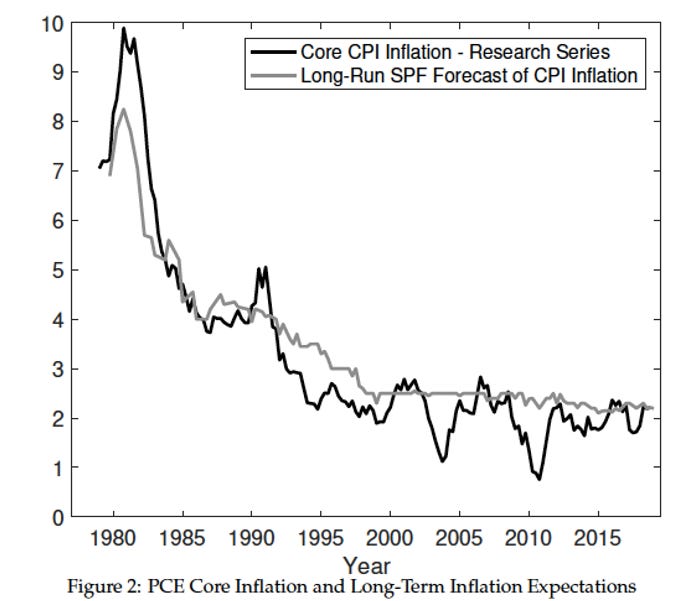
Now, the Friedman/Phelps story behind clockwise spirals did involve changing expectations: high unemployment was supposed to lead to lower actual inflation, which would over time be reflected in lower inflation expectations, which would feed through to further inflation declines. But the 80s decline is too fast to be explained that way, and seems to have started a bit before actual inflation came down.
They suggest that there was a regime shift: When people realized that Volcker was really willing to put the economy through the wringer, they marked down their expectations of future inflation in a way that went beyond the mechanical link via unemployment. Maybe, although they don’t offer direct evidence.
After listening to Nakamura, I found myself looking for other examples of regime shift. One example of the unemployment-inflation relationship I like to use for people asking to see any real evidence is that of Spain, which has had huge swings in unemployment since it joined the euro in 1999: a massive boom during the early years of europhoria, a severe slump as the country embraced austerity and tried to achieve internal devaluation, and a recovery since around 2014. I knew that the post-1999 data do look like a nice, although quite flat Phillips curve.
But what if you extend the sample back? Joining the euro was definitely a regime change that might well have shifted expectations; and sure enough:

(Inflation measured by the GDP deflator, because this was a quick-and-dirty exercise using the IMF World Economic Outlook database.)
So our story about the Volcker disinflation may be largely wrong, although Volcker’s perceived toughness may still have played a key role. But if we’re telling a different story about why inflation came down, what about our story about why it went up in the first place?
Revisiting the 70s
The truth is that I’ve always been a bit uneasy about the standard story of inflation in the 1970s, even though it seemed to fit the prediction of clockwise spirals. My uneasiness came from the sense that the economy never seemed to run hot enough to explain such a big rise in inflation. I actually remember the 70s! And while there were years of good job markets, they never felt as good as the 60s, the late 90s, or 2019.
Nakamura et al couldn’t extend their analysis back to the emergence of stagflation, because the data aren’t available. It seems pretty clear, however, that the flat Phillips curve they find would tell us that overheating can’t explain the inflation surge. So what happened?
The natural explanation would emphasize supply shocks — oil and other commodity prices — amplified by the widespread existence of cost-of-living adjustments in wage contracts. Maybe these supply shocks led to a rise in headline inflation which caused expectations to become untethered. We don’t know if that’s true, and clearly more work — exploiting whatever data we can find — is appropriate.
But suppose something like this is true. In that case, the narrative that saw stagflation both as the cost of excessively ambitious macroeconomic policy and as a vindication of conservative economic ideas was mostly wrong. And that matters not just for history but for policy right now, which is still to some extent constrained by the fear of a 70s repeat.
How do you ask someone to be the last worker to be unemployed for a mistake?
The disturbing implication of a Phillips curve that turned out to be flat is that the Fed has, for the last 48 years, pursued a policy that has kept millions of people unemployed, kept millions in poverty, and suppressed trillions of dollars in wage growth under the false belief that it would control inflation. This Phillips curve “mistake” has caused an incredible amount of damage to the American working class.
Wage growth essentially stopped after 1973 because of Nixon’s wage and price controls. Wage suppression continued with the “Council on Wage and Price Stability”, and then the Fed policy to keep unemployment high based on the Phillips curve. If wages had continued to grow with economic growth, the median income would be twice as high as it is now. The Rand paper, “Trends in Income From 1975 to 2018”, said “From 1975 to 2018, the difference between the aggregate taxable income for those below the 90th percentile and the equitable growth counterfactual totals $47 trillion.” That was a pretty expensive “mistake”!
America had terrific wage growth between 1933 and 1973. Median income went up by about a factor of 5. Most of that time there was only moderate inflation. For instance, between 1948 and 1973 real median income grew by 2.5% per year. The average inflation rate during that time was 2.4%. But between 1974 and 1981 the average inflation rate was 9.2% while median incomes shrank 1.2% per year. This is the opposite of the “higher wages cause inflation” theory.
The poverty rate went from about 70% in 1933 to 11% in 1973, and then stopped going down. If not for wage suppression poverty could have been virtually eliminated by now.
Shouldn’t the economy exist to benefit the people, instead of sacrificing people for the supposed benefit of the economy? What’s the point? That’s pretty messed up.
The 70’s inflation was not caused by an oil shock. In his 1968 paper Milton Friedman said, “Every major inflation has been produced by monetary expansion.” And Nixon did pressure his Fed chairman into an expansionary monetary policy to goose the economy in order to help him get re-elected (from “How Richard Nixon Pressured Arthur Burns: Evidence from the Nixon Tapes”). Nixon knew this would create inflation but was willing to accept the tradeoff. He said, “I’ve never seen anybody beaten on inflation in the United States. I’ve seen many people beaten on unemployment.”
The 2002 – 2008 oil shock was even bigger than the 70’s oil shock, but it did not produce inflation. That should have driven a stake through the heart of the “oil shock creates inflation” idea.
“Stagflation” wasn’t a real thing. From 1975 to 1979 the average GDP growth rate was 3.68%. That’s a funny kind of stagnation. That growth was better growth than Trump’s “greatest economy in history” and better than the 3.1% average GDP growth during the 80’s. There were 10.345 million jobs created during the Carter administration. The job growth rate of 12.82% was better than any presidential term since then. The labor participation rate was also growing rapidly. The number of manufacturing jobs hit an all-time high in 1979. I have wondered for years why people keep saying there was stagflation in the 70’s. Marcus Nunes made my day with his comment! Stagflation is like the Emperor’s New Clothes, not really there.
Robert Mundell was the economist who identified the economic condition of the late 70’s as “stagflation”. By some coincidence he had a way to fix it, Supply Side Economics. In other words the snake oil salesman diagnosed the disease that he said he could cure. His student Art Laffer cooked up a curve to show that tax cuts create economic growth so that the tax cuts would pay for themselves.
Reagan’s tax cuts did not produce any extra growth and the tax cuts did not pay for themselves (see “The Economic Consequences of Major Tax Cuts for the Rich” by Hope and Limberg). The tax cuts for the rich were paid for with public debt. From 1933 to 1981 high top tax rates effectively imposed a cap on top incomes. Reagan’s tax cuts removed that cap and allowed unlimited incomes. This enabled the top 0.1% to take the $47 trillion that the bottom 90% didn’t get.
In summary, a fake “stagflation” boogeyman was used as a justification for using the bogus Phillips Curve as rationale to suppress wages and the bogus Laffer Curve as rationale to cut top tax rates. That’s how trillions of dollars in income were redistributed from the wage earners to the rich.
In the 70s I was a young exec. leading a small team on public policy issues in the midwest and Rocky Mtn. region. The land was awash with high anxiety over commodity shortages, hyper inflation, the pragmatic value of taking on huger personal debt, and screwball investment schemes. It seemed like emotions drove most decisions, even as speakers rolled through town promoting rational choice economics. It just didn’t pass the smell test, but we were young, junior, and doubted our own suspicions in the face of senior expertise.