
How (not) to pay for building back better
The case for debt-financed infrastructure

Are we there yet? Are we there yet? Yes! The Covid relief bill has passed the Senate. It falls short of progressives’ fullest hopes — no minimum wage hike, unemployment benefits at $300/week rather than $400 — but it’s a huge and highly redistributive package.
Now what? OK, everyone involved in getting this thing through is entitled to a few hours’ sleep and the legal mood-altering chemicals of their choice. But this was a rescue package, not a long-term plan for economic revival. So as soon as everyone has recovered from this (largely gratuitous) ordeal, it will be time to start working on longer-term proposals, especially the linked issues of infrastructure and climate change.
At the moment I have no coherent thoughts about exactly what the next plan should include. But it’s not too early to weigh in on the question of how it should be paid for. And it’s important to start making the argument that by and large it needn’t, indeed shouldn’t, be paid for. Certainly we don’t want crucial infrastructure investment to be held up by paygo rules.
Saying this will, of course, drive the debt scolds crazy. Expect to hear a lot about the latest CBO long-term projection, which says — as they like to put it — that by 2051 debt will be twice the size of the economy:

I could point out that this is comparing a stock with a flow: if you use quarterly data CBO is saying that debt will be 8 times the economy, if you use decade data only 20%, and the choice of frequency is arbitrary. But more to the point, you need to know both why that projection is highly questionable and why in any case it doesn’t really matter.
What’s behind those debt projections?
Most people who think about these things at all probably assume that CBO’s big numbers on future debt are driven by the usual suspects: rising spending on retirement and health care. And this isn’t totally wrong. There are still some Baby Boomers under 65, life expectancy is still rising except when viruses are killing us off, and health spending still tends to grow faster than GDP.
But entitlement spending, it turns out, isn’t the big driver of CBO’s numbers; they’re largely caused by a big projected rise in federal interest payments:

OK, you may say, that’s what happens when you keep running deficits: you end up with more debt, which means more interest, which means more debt, and the whole thing snowballs. Right?
Actually, no. CBO’s big projected interest bill doesn’t have a lot to do with higher debt; it’s mainly driven by the assumption that the average interest rate the federal government pays on its debts will rise dramatically. Here’s the implied average rate from the CBO report:

We haven’t see interest rates that high since before the late-2000s financial crisis. Here’s the 10-year rate, taking annual averages to smooth out wiggles, since 2000:

The CBO rate projection is also very much at odds with market expectations. As of the end of last week the 20-year rate was 2.18%, the 30-year rate 2.28%, suggesting that bond markets expect rates to be not much over 2 percent a generation from now.
Of course, markets aren’t always right. But which is more reasonable: continuation of the low-interest rate environment that has persisted right through the post-2009 recovery, or a return to pre-2008 norms?
The case for low interest rates
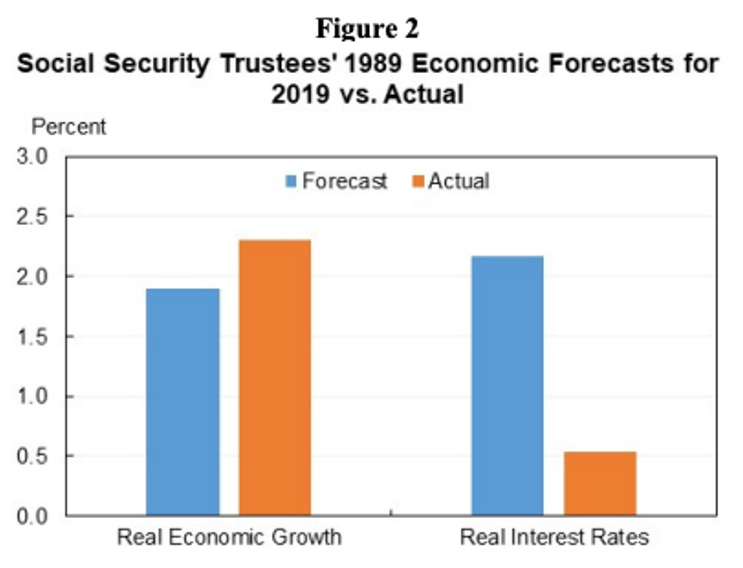
As Furman and Summers have pointed out, even before the pandemic we were living in an era of far lower interest rates than just about any official projections envisioned. Here’s one of the figures that really caught my eye:
Why did this happen? As Summers has emphasized, in a view I very much support, this really looks like secular stagnation — an era of persistently weak investment demand in which the economy needs very low and possibly negative interest rates to achieve full employment.
But why is investment demand low? One obvious explanation is demography. With weak or no growth in the working-age population, the demand for fixed capital of all kinds — office buildings, factories, shopping malls, and, yes, residences — is low. And both currently and for the foreseeable future demography looks nothing like the environment that prevailed back when interest rates of 4-5% seemed normal. Here’s the log of the prime-age U.S. population since 1995:

Technology could also drive investment demand, the way it did during the IT boom of the late 1990s. And I’m open to the possibility that technology may do more for the economy over the next few decades than it has recently. But nothing like that is in the numbers so far. Here’s total factor productivity, again in logs, again since 1995:

So the fundamentals seem consistent with market expectations of low interest rates for a very long time, not with the assumed big rate rises that drive scary-looking debt projections.
But what about the role of government spending, both the big package that just passed the Senate and possible future initiatives?
Stimulus now and later
I’ve just argued that private investment demand is likely to be weak for the foreseeable future. But what about the demand boost from the big bill that just passed the Senate? Some economists worry that the bill could cause the economy to overheat; I don’t think they’re right, but it’s not a silly concern. And interest rates have risen since the beginning of the year, first after Democratic victories in the Georgia special elections made a major relief package possible, then as Dems showed surprising unity in backing a really big package. The market is in effect pricing in the possibility that the Fed will raise rates to head off inflation.
But the rate rise hasn’t been especially large; 10-year real rates are still negative, and even the 30-year real rate was only 0.12 percent as of Friday. Why is the reaction to such a huge package so muted?
The answer is that the fiscal boost is overwhelmingly short-lived. The main components of the plan — stimulus checks, enhanced unemployment benefits, emergency aid to state and local government, direct spending on vaccinations and school openings — will be gone by the end of 2021. Here’s the CBO estimate of deficit impacts by fiscal year from the House version, which will be close to the Senate version (bear in mind that fiscal 2022 includes the last quarter of calendar 2021):

It’s true that Democrats hope that some features of the bill — child tax credits and expanded ACA subsidies — will become permanent. But they’re a fairly small fraction of the total.
This has two implications. First, we’re likely to remain in a low-interest world, in which federal debt isn’t a big problem, for a long time despite this big slug of spending.
Second, even if there’s a short-term boom as the pandemic subsides and money from the American Rescue Plan flows into the economy, we’ll probably be back in secular stagnation — where it takes very low interest rates to achieve full employment, even in good times, and the Fed lacks the ammunition to respond in bad times — after a year or two.
And those two implications make the case for a sustained program of public investment that isn’t paid for, that’s deficit-financed. Such a program would do double duty: We need the infrastructure, and it would also provide continuing stimulus in an economy that needs such stimulus, giving the Fed room to respond when adverse shocks hit.
And because interest rates would stay low, the debt service from such a program isn’t likely to pose a problem.
Democrats will soon move on from their relief bill triumph and focus on longer-term investment. And one big question they’ll ask is how to pay for such a program. Well, the answer is: don’t pay for it. Just do it.
I'm pleased that Krugman is taking the natural logarithm on some of his charts. A linear vertical scale can be misleading for people who are not economists, engineers or mathematicians. A log scale ensures that equal percentage changes look the same for all time periods. This also means that a constant annual percentage growth rate appears as a straight line with its slope proportional to the growth rate.
The main reason to not tax wealth or higher incomes to pay for infrastructure is simply that with a 50-50 split Senate throwing in big new taxes on wealth could delay or compromise the really important investments in clean energy and infrastructure. Tax increases could be considered later as a separate issue after the spending bill gets through Congress and is signed into law.
Recall the famous debt-to-GDP record: United Kingdom, 1815, 295%. (By one estimate, others are a bit different, say 260%). The true ratio was certainly high, but it's iffy on both sides. One, nobody had a halfway decent estimate of total British national product on any metric; the concepts hadn't been invented. Two, the Treasury had a nominal total for debt, but this did not mean much. It was mostly in Consols, perpetual bonds. What's more, they all had the same coupon, 3%. This had been picked by Pelham several wars back in 1757, and was usually lower than current interest rates. When governments needed to borrow yet more money to defeat the obstinate and expensive French, they just sold more 3% Consols at whatever discount the market imposed. So the nominal debt total was inflated, perhaps by 50%. Anyway, all that mattered was the interest payable, and this the Treasury and Bank knew exactly. Investors like Jane Austen's Mr. BIngley had an unmatchably liquid and safe long-term asset.